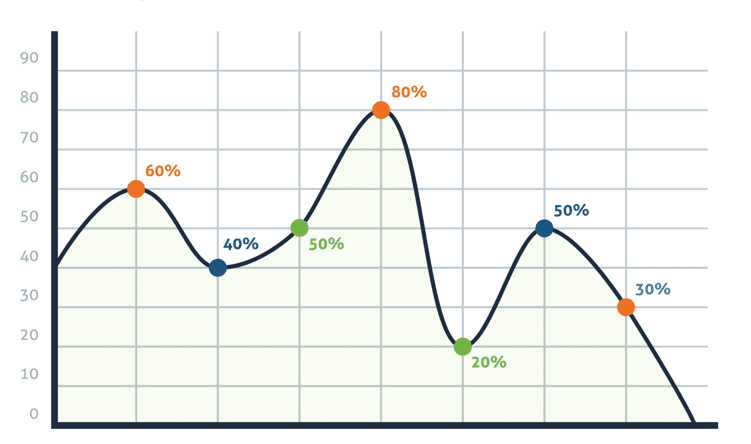
What is a Spread Diagram?
When solving a problem or analyzing a situation, it is necessary to know the relationship between two variables. A scatter diagram is a qualitative tool used to investigate the relationship between two variables.

Uses of Spread Diagrams
- It can be used to examine the relationship between two variables.
- It can be used in situations where for each value of one variable there is a corresponding value of the other variable.
- It can be used to investigate the root causes of problems.
- It can be used to find out whether the reason found when using the fishbone diagram is really related to the result, in what direction and to what extent this information is effective.
- It can be used to see whether two different results are due to the same cause.
What are the Benefits of Spread Diagrams for Businesses?
- It makes complex data sets understandable by visualizing the relationships and distributions of data. In this way, it makes the data analysis processes of businesses more effective.
- It can visually show the relationship between variables in the analyzes that businesses will evaluate. As a result, it can understand the relationship between different variables and perform correlation analysis.
- Methods used to identify abnormal or unexpected values in the data set contribute to businesses to quickly identify and solve problems in their data sets.
- Analyzing trends by showing changes over time helps businesses to predict future trends and make strategic decisions.
- It helps businesses to make data-driven decisions in the decision-making process.
7 Analysis Tool
- Fishbone Diagram
- Control Schedule
- Control Diagram
- Histogram
- Pareto Diagram
- Spread Diagram
- Flow Diagram

